
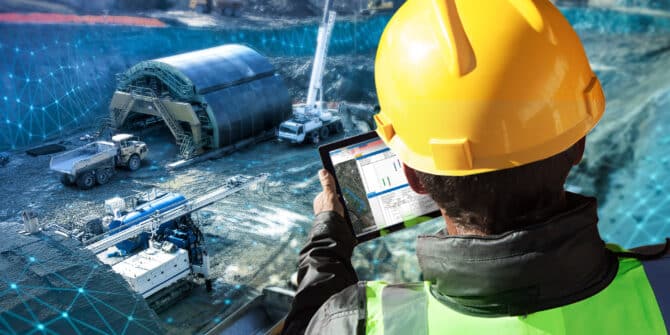
Transforming Tailings Management: OceanaGold’s Digital Twin Initiative at Waihi
In an industry striving for best practice in Tailings Storage Facility management, OceanaGold’s digital response to their Waihi operations offers ...


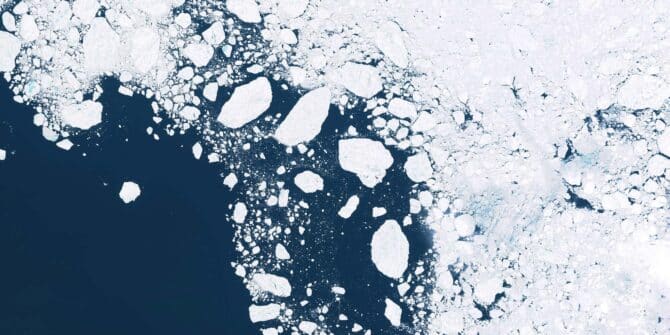
Revealing the fractured ice of Antarctica’s “Doomsday Glacier”
Dr Jamin Greenbaum and the team are working at the front line of climate change on the coldest continent on ...
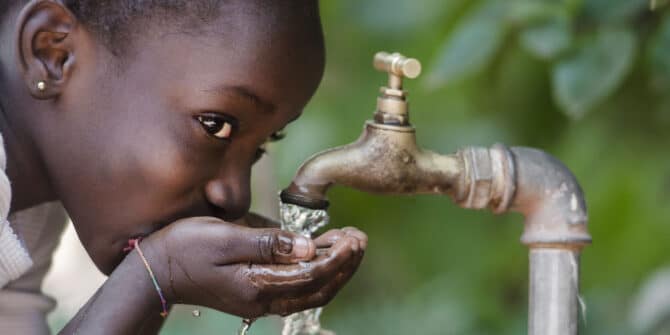
Creating a positive ripple effect: Data-driven transparency as a tool for building consensus on water
Seequent Segment Director for the Environment, Thomas D. Krom shares reflections on society’s need for water given global warming, looming ...
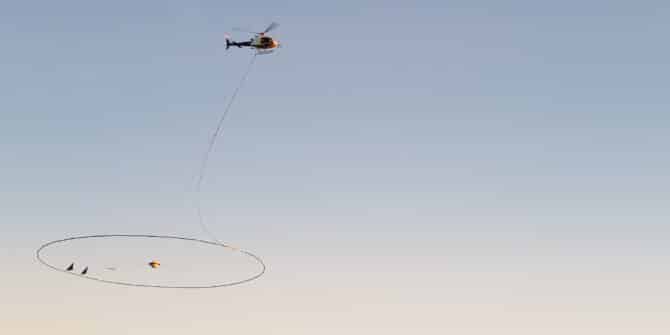
Geophysics for Groundwater: Tools for Contamination and Aquifer Detection
Discover how to leverage DCIP and TEM survey data for effective aquifer location and contamination detection in our on-demand webinar ...
Ground to Cloud | Featuring HATCH’s Journey with OpenGround & Latest Developments
Additionally, you'll learn about HATCH's transition to OpenGround and how they're maximizing the features of the modern platform. HATCH, a ...