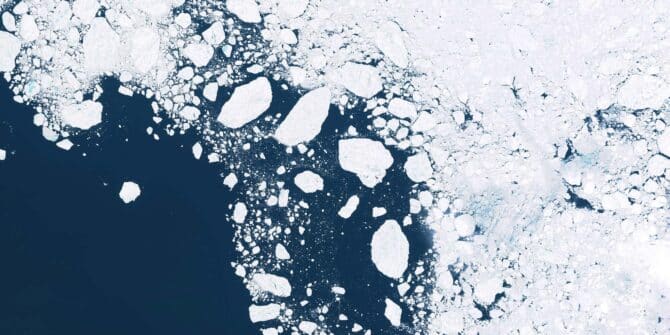
Revealing the fractured ice of Antarctica’s “Doomsday Glacier”
Dr Jamin Greenbaum and the team are working at the front line of climate change on the coldest continent on ...
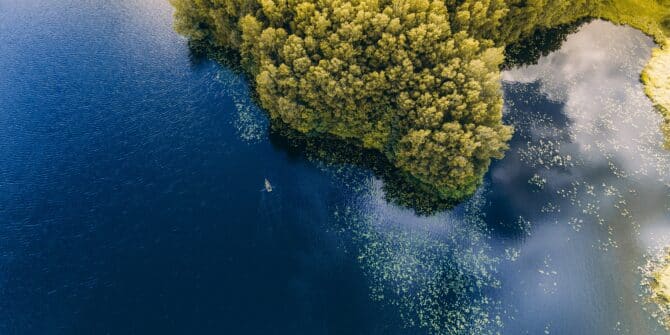
Creating a positive ripple effect: Data-driven transparency as a tool for building consensus on water
Seequent Segment Director for the Environment, Thomas D. Krom shares reflections on society’s need for water given global warming, looming ...
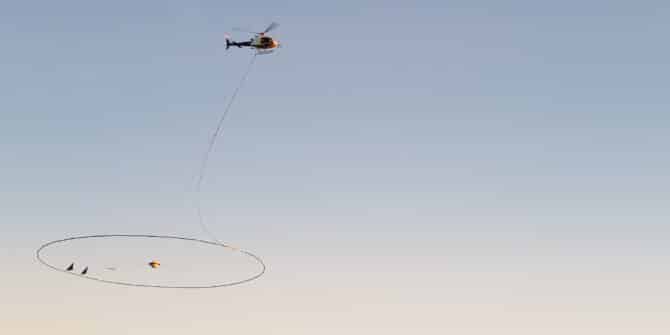
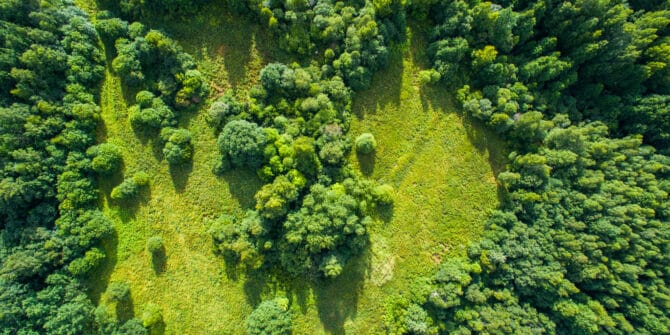
Geophysics for Groundwater: Tools for Contamination and Aquifer Detection
Discover how to leverage DCIP and TEM survey data for effective aquifer location and contamination detection in our on-demand webinar ...

Ground to Cloud | Featuring HATCH’s Journey with OpenGround & Latest Developments
Additionally, you'll learn about HATCH's transition to OpenGround and how they're maximizing the features of the modern platform. HATCH, a ...
GeoStudio Answer Hour: New Features in GeoStudio
GeoStudio 2024.1 continues to build on Seequent’s geotechnical analysis solution, with the addition of many new SLOPE3D features. This release ...

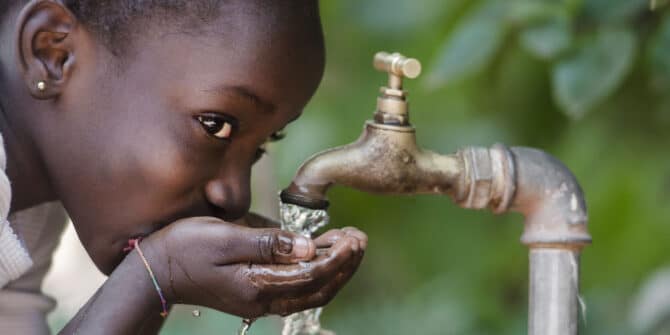
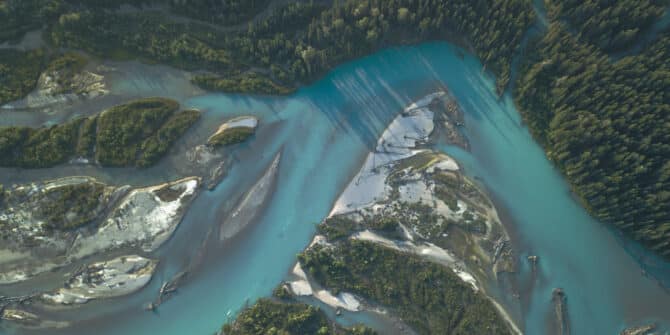
Groundwater: The Lifeline of Global Communities and Economies
On World Water Day 2024, Seequent underscores the critical role of groundwater in sustaining life and economies globally. Our infographic ...